Facts & Figures
What is Natural Gas?
- Natural gas is the earth’s cleanest burning hydrocarbon.
- Its combustion does not produce ash residues, sulphur oxides, and only negligible nitrogen. This sets it apart from all the other fossil fuels.
- Natural gas forms organically over millions of years from decomposing plant and animal matter that is buried in sedimentary rock layers. Once formed the gas tends to migrate through the pore spaces, fractures, and fissures in the sediment and rocks.
- Some of this gas makes it to the surface naturally showing up in seeps, while the other gas molecules move until they are trapped in impermeable layers of rock, shale, salt, or clay.
- These trapped deposits are the reservoirs used to recover natural gas, typically located between 1 and 7.5 kilometers deep.
- Natural gas is found throughout the world either by itself or in association with crude oil, both under dry land and beneath the ocean floor.
- Methane, or CH4, is the primary component of natural gas.
- When it is found in nature, raw natural gas may also contain some mixture of butane, propane, and pentane gasses, as well as some nitrogen, carbon dioxide, and water vapour.
- Prior to entering market the raw natural gas undergoes processing, which purifies it into methane with some ethane.
Types of Resources
Conventional
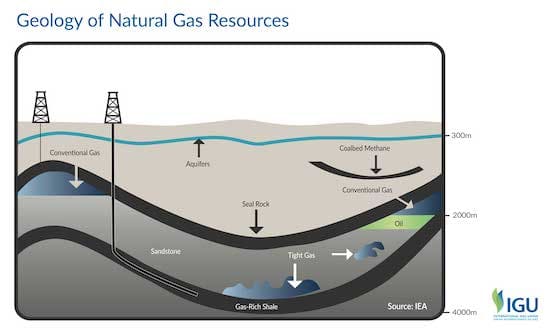
- These are the simplest formations, or geological traps, of natural gas, which result from the gas migrating through the pores in permeable rock, until it reaches an impermeable rock cap and becomes trapped.
- The lower specific gravity of natural gas, than that of other materials found in the earth, causes it to migrates up, leaving water and other materials at the bottom.
- When a well is drilled into such a reservoir, the gas flows upwards through the well, forced by its higher pressure beneath the surface.
Unconventional

- Tight Sands Gas is trapped in sandstone and carbonate, which has very low permeability, thus restricting its ability to flow to the surface.
- Coalbed Methane is absorbed by the solid coal particles in coal and extracted from coal mines usually by removing water from the reservoir.
- Shale Gas is formed in low permeability shale rock and trapped in clay particles or in small pores and micro-fractures in the rock.
- Methane Hydrates refers to a form of porous ice that traps methane molecules, the chief constituent of natural gas. Hydrate deposits generally occur deep under Arctic permafrost, and beneath the ocean floor. 1 m3 of gas hydrate releases 164 m3 of natural gas when extracted.
Resources vs Reserves
Resources
- Resources are estimated volumes of natural gas – discovered or undiscovered.
- Estimates of discovered resources are quantities of gas in known reservoirs, that may be remote from existing pipelines and markets.
- Undiscovered resources are estimates based on geological data of gas volumes thought to be recoverable under current or anticipated techno-economic conditions.
Reserves
- Natural gas reserves have high certainty estimates of volumes that are recoverable, under existing technological and economic conditions.
- Reserves are accessible through existing pipelines and markets.

Movements of Natural Gas
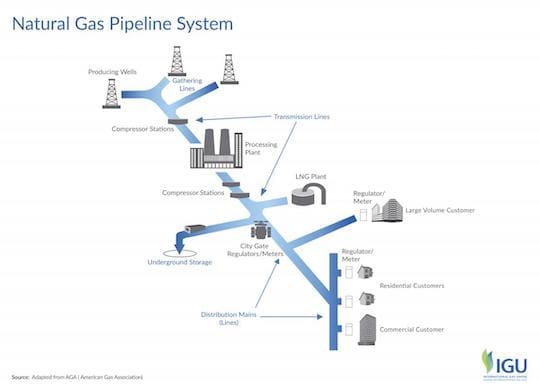
Pipeline Network
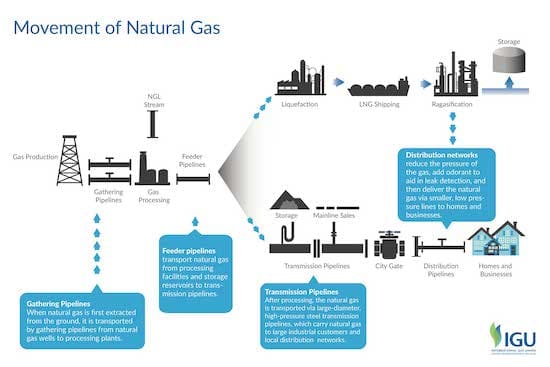
- An extensive network of high and low-pressure pipelines enables transportation of natural gas from production to demand points.
- There are three major types of pipelines along the transportation route: the gathering system, the transmission pipelines, and the distribution lines.
- The gathering pipeline system includes low pressure, small diameter pipelines that transport raw natural gas from the production site to the processing plant, where it is purified and prepared for the end-use consumption.
- Transmission pipelines are large diameter, high-pressure lines carrying large volumes of natural gas over long distances to consumption, or export hubs.
- Distribution line system is the smaller diameter distance network that delivers natural gas to low final consumers, including homes and business, but excluding large industrial users who are connected directly to the transmission system.
LNG
- Natural gas can also be shipped over long distances as a liquid, known as liquefied natural gas, or LNG.
- In order to transform natural gas into liquid phase, it has to be chilled to -160 degrees C(-256 degrees F) at atmospheric pressure.
- This reduces the gas volume by 600 times and makes it possible to transport very large energy content over short and very long distances in specially-designed ocean tankers and trucks.
- When the shipment of LNG reaches its destination at the receiving terminal, it is re-heated and converted back to a gas via a process known as regasification. It is then sent through pipelines for delivery to end-users.
Natural Gas Value Chain
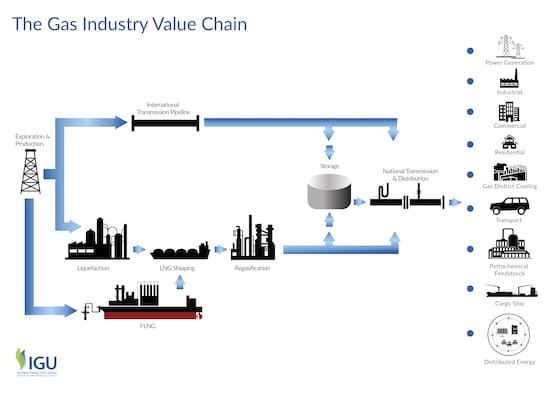
- The natural gas industry value chain consists of a sophisticated network of supply, transit, storage, and demand components.
- Natural gas is not only a key input into primary energy systems, but also a valuable feedstock for industries.
- The natural gas value chain is also an evolving organism, as the industry continues to innovate in bringing new possibilities of accessing, delivering, and using its product.
- The nascent floating LNG (FLNG) and regasification technologies, for instance, are already starting to change the way this value chain will look in the near future.
Unit Conversion
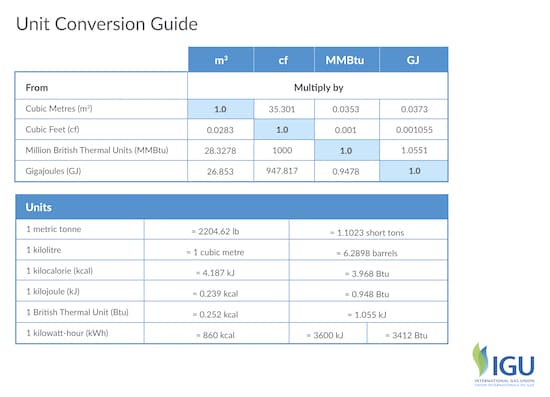
Natural gas can be measured in metric or imperial units
- by energy content: Gigajoules (GJ) or Million British Thermal Units (MMBtu)
- or by volume: Cubic Metres (m3) or Cubic Feet (cf)
Sustainability: Value
Environmental Value of Natural Gas

- Natural gas is the cleanest burning hydrocarbon, which offers a sizable opportunity to reduce global CO2 emissions almost immediately, especially in the developing regions.
- Natural gas produces the least CO2 of all fossil fuels, because of its high heating value, low carbon content and efficient combustion. This applies across all its end-uses.
- Natural gas does not pollute the air. Its combustion is nearly free of harmful air pollution, making it a healthy fuel choice for households, industries, transport, and power.
- Natural gas-powered electricity generation produces less than half of GHG emissions, than that of coal and up to a third less than oil.
- In industry, natural gas delivers big emissions reductions, and can also provide significant savings when manufacturers switch from oil to LNG in areas that previously had no access to natural gas, due to its cost advantage over oil.
- Natural gas is used in industry in a variety of applications, and its GHG benefits will depend on the application. For example, in industrial boilers natural gas provides 20-35% CO2 advantage over oil, or coal,1 and a natural gas fueled combined heat and power application could reduce emissions in half.
- For road transport natural gas provides a large GHG advantage: 22.5% relative to gasoline for passenger vehicles and 7% compared to diesel.2
1 https://www.epa.gov/sites/production/files/2015-12/documents/iciboilers.pdf
2 NGVA Europe Thinkstep (2017) “Greenhouse Gas Intensity of Natural Gas” http://ngvemissionsstudy.eu/


Methane Emissions
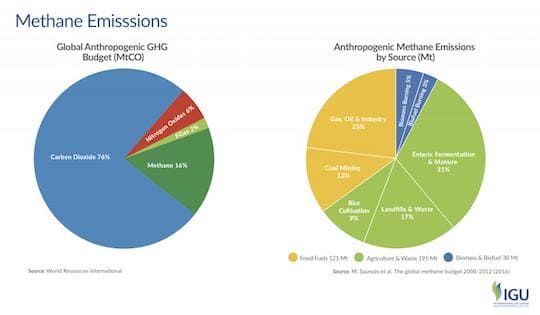
- Natural gas is the cleanest burning hydrocarbon fuel that produces roughly half of the CO2, compared to coal, and about 20% less than oil.
- An exact measure of methane emissions, attributable to different sources is difficult to accurately measure and allocate with existing technologies, but ongoing innovation efforts are continuously improving their state of the art and our ability to better quantify emissions.
- The body of knowledge in this area is evolving, improving our understanding of methane emissions and their sources, as well as the quality and quantity of available data.
- The IEA estimated the total combined oil and gas methane emissions at 76 Mt in 2015, which represents roughly 13% of the total global methane budget (IEA, WEO 2017)
Understanding the Issue of Methane Emissions
- Methane (CH4) is the main component of natural gas.
- Natural gas combustion is highly efficient, so in its end-use applications of providing energy for cooking and heating, fueling transport, and producing electricity, the associated methane emissions are insignificant.
- However, some methane emissions can occur earlier in the value chain during extraction, production, transport, and distribution. These are reflected in the natural gas CO2 emission factor, or its GHG footprint.
- Methane is the second most important GHG after CO2. Its greenhouse gas effect is stronger in the short term, which makes it a more potent short-term climate forcer than CO2. However, it also has a much shorter mean life in the atmosphere – only 12.4 years, in contrast to centuries for CO2. So, the key climate impact of methane is on short-term temperature fluctuations, while CO2 is the key driver of long-term climate impacts, due to its very long life.
*For more information on the issue of methane emissions and climate change, and industry’s actions to tackle this issue, please see IGU reports: Understanding Methane’s Impact on Climate Change and The Natural Gas Industry’s Methane Emissions Challenge
Sustainability: Electricity
Reliable Partner for a Secure and Sustainable Generation Mix

- A renewables and natural gas generation mix provides for secure, responsive, and reliable electricity supply portfolio.
- When it comes to investment decisions in capital-intensive generation assets, the goal is to minimize risk, maximize return, while ensuring energy security, access, and reliability of supply for the consumers.
- Natural gas and renewable projects both have associated investment risks, as any large, long-term energy asset.
- Interestingly, the risk profiles of renewables and natural gas generation technologies are practically mirror opposites, which makes these two types of generation sources a perfect match. So, together, renewables and natural gas form a strong and balanced electricity investment.
- The illustrative matrix shows risks associated with hypothetical natural gas (left) and renewable energy (right) plant
Responsive, Flexible, and Clean Electricity Generation Resource

- Natural gas delivers the least lifecycle GHG emissions per kilowatt-hour of generated electricity when compared to other fossil fuels.
- Paired with carbon capture and storage technology, natural gas GHG profile is comparable to renewable sources, while it does not produce any particulate matter and sulphur oxide emissions, unlike coal, or oil.
- According to the IEA, gas-fired power plants have technical and economic characteristics that make them a very suitable partner for a strategy favouring the expansion of variable renewables. (IEA,2017).
- Natural gas-powered generation is highly flexible and responsive. It can reliably provide a variety of valuable flexibility services to electric system operators, from capacity to operating reserve, and regulation.
- At higher rates of renewables generation, grid flexibility services become more and more essential, and natural gas generators are the ideal technology to provide this flexibility.
- Natural gas is responsive. It is able to ramp up and down quickly and operate at low utilization rates for grid balancing, while also being available to increase generating load and provide on-demand capacity.
- With ongoing innovation efforts, the industry will continue to improve the responsiveness of the natural gas units even further.

Low-Emission Source of Reliable Power

- Natural gas in electricity generation is an environmentally friendly fuel and has significant ecological and environmental advantages over other fuels, resulting in cleaner air and higher productivity.
- IEA, 2017: “Taking into account the efficiency of transforming thermal energy into electricity, a combined cycle gas turbine emits 350 grammes of CO2 per kilowatt hour, well under half of what a supercritical coal plant emits for the same amount of electricity.” (IEA, 2017)
Sustainability: Transport
Clean Fuel for Road Transport
- Natural Gas, used as vehicle fuel, delivers significant environmental and ecological benefits by reducing GHG emissions and drastically cutting pollution.
- For passenger vehicles, compressed natural gas (CNG) delivers 22% reduction in GHG emissions over gasoline, and 7% over diesel (on a lifecycle basis).
- Even larger benefits can be achieved by switching older fleet vehicles to new CNG vehicles would result in significant air quality benefits.
![]()
Clean Fuel for Marine Transport and Shipping
- LNG used as a marine fuel offers notable GHG advantages over conventional fuel oil and modified diesel, while also eliminating harmful exhaust pollutants.
- LNG as a marine fuel also offers substantial advantages over traditional marine petroleum fuels in local pollution emissions reduction.
- It meets the stricter environmental regulations controlling air pollution from ships by the International Maritime Organisation (IMO) and regional air quality controls.
- Using LNG will reduce harmful air pollutants significantly below all current and proposed emissions standards – switch to natural gas will immediately result in these reductions and persist for the life of the vessel.
For more in-depth analysis of the benefits of adopting LNG as marine fuel, please see the IGU report Enabling Clean Marine Transport.

Sustainability: Heat
Clean and Efficient Heating Fuel
- Natural gas is the ideal sustainable heating fuel option.
- It burns cleanly and efficiently, providing for a safe and comfortable environment within homes and businesses
- Its highly efficient combustion ensures minimum waste and low GHG profile.
- It is accessible, affordable, and reliable.

Sustainability: Health
What is Air Pollution?

Air Pollution
- Air pollution is the presence of certain solids, liquids, or gases in the air, which can harm people or environment. In high concentrations, it can be detrimental to human health.
- Pollution is responsible for 6.5 million deaths each year. It is the fourth-largest human health concern, after blood pressure, diet, and smoking.
- Pollutants occur both naturally and from human activity (anthropogenic); however, the latter is a significantly larger culprit, as most air pollution results from energy and industry.
- 85% of particulate matter emission is the result of energy production and use.
Particulate Matter
- Particulate matter (PM) is a mix of solid/liquid organic and inorganic substances that may be a primary or secondary pollutant.
- PM is linked to major detrimental health impacts.
- Size is an important factor in determining health impacts – the smaller the particle, the more dangerous it is.
- Coarse Particles are between 2.5 and 10 micrometres (μm) in diameter.
- Fine Particles are smaller than 2.5 μm.
- The adverse health impacts of PM10 are less severe than those of the fine particles; however, there is a longer history of data on PM10 and even today many cities lack the equipment to monitor outdoor concentrations of PM2.5.
- Black carbon, a particular type offine PM, is formed by the incomplete combustion of fossil fuels and bioenergy, and is a short-lived climate pollutant (SLCP).
Other Anthropogenic Air Pollutants
- Sulphur Oxides (SOx): Raw coal and oil contain sulphur, which causes SOx to be released into the atmosphere with combustion, unless there is a pre-treatment process that removes the sulphur. SOx pollutants are damaging to health and environment, as well as being a precursor to the formation of secondary particulate matter.
- Nitrogen oxides (NOx): nitrogen oxide (NO) and nitrogen dioxide (NO2) result from high-temperature combustion, largely in transport and electricity generation, or from the oxidation of NO to NO2 in the atmosphere. NO2 is a toxic gas and can lead to the formation of particulate matter and ozone.
- Carbon monoxide (CO) is a colourless, odourless, toxic gas that comes from the incomplete combustion of fuels.
- Ammonia (NH3) is released in relation to agricultural and waste management activities; once in the atmosphere ammonia reacts with oxides of nitrogen and sulfur to form secondary particles.
- Ground-level ozone (O3) is formed from NOX and VOCs in the presence of sunlight. At high concentrations, ozone is a pollutant and a SLCP.
- Heavy Metals resulting from industry, power generation, waste incineration and Mercury mainly from burning coal.
Household Energy and Health

- Around 3 billion people cook and heat their homes using open fires and simple stoves burning biomass (wood, animal dung and crop waste) and coal.
- Over 4 million people die prematurely from illness attributable to the household air pollution from cooking with solid fuels.
- More than 50% of premature deaths due to pneumonia among children under 5 are caused by the particulate matter (soot) inhaled from household air pollution.
- 3.8 million premature deaths annually from non-communicable diseases including stroke, ischaemic heart disease, chronic obstructive pulmonary disease (COPD) and lung cancer are attributed to exposure to household air pollution.
For more information on household air pollution, see for example: the World Health Organisation, International Energy Agency, UN Environment.

Air Pollution is a Leading Global Cause Premature Deaths

- Air pollution is the fourth largest cause of premature death in the world, after blood pressure,diet,and smoking.
- Natural Gas is a clean burning fuel and does not produce toxic PM emissions.
- Household pollution caused 4.3 Million deaths in 2012, while Outdoor pollution caused 3 Million deaths.
- This mortality burden is disproportionately born by the developing world, especially for household pollution, due to lack of access to clean cooking and heating energy.
- India and China is where over half of premature deaths occur, for both indoor and outdoor pollution.
- Globally, the deaths attributable to ambient air pollution have been on the rise. Globally the total number of deaths from PM 2.5 pollution has grown by 31%, between 1990 and 2013.
- However, two regions have shown improvement. In Europe & Central Asia region and North America, pollution-caused deaths dropped by 25 and 30 percent, respectively, between 1990 and 2013. Both these regions experienced coal to gas in the same period. While other factors, including transport emissions and fuel efficiency standards played a significant role in this positive outcome, the fuel switch from coal to gas has likely contributed, as natural gas is free of most toxic pollutants emissions, while coal is a major source, along with biomass and other solid fuels.

Access to Clean Energy

- Nearly half of the world’s population still lacks access to clean and safe energy in the home.
- Universal access to modern energy services by 2030 is one of the United Nations sustainable development goals (SDG’s), and progress toward meeting it has thus far been slow.
- Highly polluting fuels, including coal, biomass, and kerosene are the primary source of household energy for 41% of the World population.
- Pollution from these fuels is linked to millions of premature deaths and “several billion hours spent collecting firewood for cooking, mostly by women, that could be put to more productive uses.” (IEA, 2017).
- This is a stark inequality problem, as the IEA states:“(t)he type and level of energy-related air pollution is often linked to a country’s stage of economic development. At low-income levels, households tend to be heavily reliant on solid biomass (as in many developing African and Asian countries) the use of which usually leads to undesirable exposure to particulate matter, a leading cause of premature deaths.” (IEA, 2016)
- Access to natural gas would solve this issue, as its combustion does not produce the harmful pollutants, responsible for severe health consequences. However, this would require governments and international community to step up and support the development of infrastructure, as well as commercializing new technologies development to bring the costs of access down.
- While infrastructure investments are costly, the social and economic benefits associated with reduced pollution, avoided deaths, and increased productivity make them worthwhile.
Evolution of Global Reserves by Region

- The supply of natural gas is secure, accessible and affordable for the foreseeable future.
- Natural gas is a fuel that performs strongly on security of supply considerations:
- There are sufficient global deposit volumes to meet projected demand.
- Deposits are geographically diverse.
- Access is greater than it has ever been with the advances in LNG shipping technologies and evolving business models.
- “The remaining resources of natural gas are sufficient to comfortably meet the projections of global demand growth to 2040 and well beyond.” (IEA,2017).
- At the end of 2016, proven reserves were about 215 trillion cubic metres (tcm), equal to around 60 years of production at current output rates.
- Global resources of natural gas are estimated at nearly 800 tcm, around 45% of which are unconventional gas (tight gas, shale gas, CBM), deposits of which are geographically more widespread than conventional resources. (IEA,2017).

Natural Gas Resources

- The most pronounced trend in the evolution of world’s proven resources is the divergence between conventional and unconventional resources.
- Shale has been visibly growing, while the conventional base is slowly reducing.
- The IEA estimated proven resources of natural gas at nearly 800 tcm, with unconventional gas representing around 45% – these are also more geographically spread out across the world, than the conventional resources.


Global Production

The world’s top six natural gas producers are (2016):
1. United States (749 bcm)
2. Russia (579 bcm)
3. Iran (202 bcm)
4. Qatar (181 bcm)
5. Canada (152 bcm)
6. China (138 bcm)

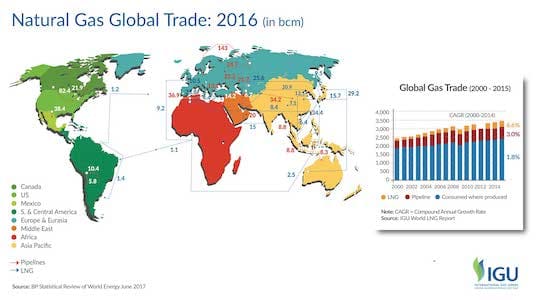
Movement: Global Modes
Global Movement of Natural Gas

- Natural gas can be moved in its normal gaseous state via pipelines, or in liquefied state by specialized carriers(ships or trucks).
- The majority of global trade today still happens via pipelines: 68%, with the remaining 32% moved by LNG
- Over the last 15 years, LNG trade volumes grew at double the rate of pipeline volumes: 6.6% versus 3%; although the rates have converged slightly in the recent years.
- It is expected; however, that the share of LNG will continue to grow in the coming years, as the world will add 140 BCM, or 40% of all LNG traded in 2016, of new liquefaction capacity by 2020, mainly from the U.S., Australia, and Russia.
Movement: Pipelines and Storage
Natural Gas Infrastructure: Pipeline Systems
- The pipeline transportation network for natural gas consists of several interlinked segments, which are designed to deliver natural gas to customers quickly and efficiently on demand – from origin of extraction to destination where there is demand.
- The design and construction of these networks is based on careful analysis of expected demand. It must consider not just the total volume, but also the types of customers, their needs, and use patterns; as well as, any projected changes over the long life of the assets. Environmental, regulatory, safety and many other considerations are the other determining factors.
- The optimal layout and size of mid-stream gas infrastructure, transmission, and distribution networks in particular, depends on the variability of gas consumption and, importantly, the maximum level of gas consumption within a year (often called peak gas demand).
- The system capacity has to be large enough to meet sudden peaks in demand instantaneously; for example, during an unexpected on set of cold weather, where gas is used for heating.
Types of Pipelines

- The pipeline network that delivers natural gas from the well to the customer consists of different segments that vary in size and characteristics, based on the function they perform.
- Transmission lines are the largest, transporting gas in large volumes overlong distances (like highways). The natural gas in these is traveling at high pressure to ensure fast and efficient transit: above 5,000 kPa (20-50 times that of a car tire). The speed at which gas travels is roughly 40 km/h, with compressor stations along the route to help maintain this speed over long distances.
- Supply lines are like the off-ramps from the highway – pressure drops to 2,400 kPa – taking the gas from transmission to the step – down regulator stations, which then reduce the pressure further to distribute to consumers.
- Distribution lines move the natural gas through cities a significantly smaller pressure of 400 kPa.
- Service lines are the smallest piece of the system, connecting it directly to homes and businesses (2 kPa).
Offshore Pipelines
- Aside from the land-based pipelines, there are also deep sub-sea pipelines, used for transmission of gas either from an offshore well, or simply for cross-sea transport.
- The process of laying these lines can be considered a golden standard of safety and sophistication in infrastructure engineering.
- Offshore pipelines can run at depths, as large as 2 kilometres, and range in diameter from 60 centimetres, to over a metres (different sections of the pipeline may have to be different in size and thickness to withstand pressures differences.).
- Subsea gas pipelines account for over 40% of natural gas trade in Europe.
Storage

- Natural gas storage is an important part of movement infrastructure, as it allows for flexibility in matching demand and supply at all times.
- Natural Gas is commonly stored underground under high pressures in underground facilities such as depleted oil/natural gas reservoirs, aquifers and salt cavern formations.
- Depleted oil/gas fields are the preferred gas storage facility as they use existing wells, gathering systems and other infrastructure and are also widely available.
- While aquifers tend to have similar geology to depleted production fields, they usually require more base gas and provide less flexibility in injecting and withdrawing.
Movement: LNG
Liquefied Natural Gas (LNG)

- LNG is a clear, colourless, and non-toxic liquid which forms when natural gas is cooled to -162 ºC (-260 ºF).
- The cooling process shrinks the volume of the gas 600 times, making it easier and safer to store and ship. In its liquid phase, LNG will not ignite.
- This allows it to be shipped safely and efficiently on specially designed LNG vessels.
- After arriving at its destination, LNG is warmed to return it to its gaseous phase and delivered to natural gas customers through local pipelines.
Safety & Environment
- LNG is a tried and true technology that has enabled safe transportation of natural gas to remote markets for over 50 years.
- On the ground, an LNG spill would not damage the ground or leave any residue as it evaporates.
- In water, LNG is insoluble and would simply evaporate, making water-spill cleanup unnecessary.
- LNG is not stored under high pressure and is not explosive. LNG vapours (methane) mixed with air are not explosive in an unconfined environment.
LNG Markets (R)evolution

- In 2016, a total of 35 countries received LNG shipments, while global regasification capacity has doubled in the last decade.
Liquefacation
- Global nominal liquefaction capacity grew to 339.7 MTPA as of January 2017, an increase of approximately 10% relative to end-2015.
- Under-construction capacity totaled 114.6 MTPA as of January 2017.
- With more than 55 MTPA of capacity online and more than 30 MTPA expected online in the next two years, Australia is expected to become the largest liquefaction capacity holder in 2018.

Regasification
- Regasification capacity growth in the coming years is concentrated in existing Asian markets, particularly China and India.
- Japan, Pakistan, Thailand, Singapore, and Malaysia are among the other Asian importers set to expand capacity by end-2018.
- New LNG markets are still expected to materialize around the world. Beyond Colombia, which reached commercial operations at its first terminal in 2017, the Philippines, Russia (through an FSRU in Kaliningrad), and Bahrain are expected to complete their first regasification projects in the near-term.
- Further out, Ghana, Bangladesh, Uruguay, Croatia, Myanmar, Ivory Coast, Morocco, South Africa, and Sudan all have project proposals announced to come online by end-2020.

Revolutionary LNG Technologies: FLNG and FSRU
Floating LNG (FLNG)
- FLNG is a novel technology that allows a vessel with liquefaction capability to tap directly into remote offshore fields and load it directly onto an LNG carrier, avoiding the need of building expensive underwater pipeline infrastructure.
- FLNG can vary in size, from very small modular units of 0.7 bcm per year to large vessels of 5 bcm per year capacity, but they are typically smaller than standard onshore liquefaction plants.
- As this technology gains commercial deployment experience, costs will come down, and it will unlock gas deposits currently uneconomic to access, due to their remoteness and smaller size.
- There is currently only one such vessel in Malaysia, with several in the investment pipeline.
- Planned projects include: a large vessel (4.7 bcm / year) to kick-start development of Mozambique’s remote offshore field, while smaller FLNG vessel (just under 2 bcm a year) is planned to produce LNG for some eight years from the tiny Kribi field off Cameroon’s coast.

Floating Storage and Regasification (FSRU)
- Floating Regasification Units are the ideal counterpart to FLNG, although they can function separately as a mobile regasification service.
- These vessels can be moored at sea or docked in a port to re-gasify LNG and feed it into a transmission or distribution network, or deliver it directly to an end-user.

Energy Access
- FSRUs are an exciting technological breakthrough for energy access. They provide an affordable, fast and flexible way to get access to natural gas supplies.
- Developing countries that lack existing infrastructure need to develop their gas markets gradually. One way of doing so is to establish a base consumer, such as a power plant, and then gradually expand infrastructure from there.
- LNG-to-power projects are being pursued in Ghana, Namibia, Senegal and South Africa to create a domestic gas market.
- FSRUs are scalable, fast to deploy and require substantially less (sunk) capital than an onshore terminal or a large cross-border import pipeline project
- The cost of a new FSRU including the necessary auxiliary facilities can be 40-50% lower than that of an onshore facility while LNG tanker conversions are even less expensive.
- Over 20 FSRU terminals are in operation and several more are under construction, worldwide. Many are in countries that have existing gas markets (e.g. Pakistan, Argentina, Brazil or Egypt) in order to replace, supplement existing supply.
- The relative ease of moving floating facilities (both FSRU and FLNG) means they can easily be redeployed, which reduces risk for investors and lowers the hurdles for access to finance that are important considerations for developing countries.
- This technology can help developing countries to shift from more costly oil products or more polluting coal to gas when this would otherwise not be possible or economically viable.
Source: IEA, 2017
Global Natural Gas Trade
- The global natural gas market is in an exciting stage of transformation. It is becoming increasingly more flexible, diversified, and liquid.
- The abundance of new supply, combined with the LNG revolution are fuelling dynamic growth and diversification, with more and more trading routes emerging.
- For the third consecutive year, global LNG trade set a new record, reaching 258 million tonnes (MT). This marks an increase of 13.1 MT (+5%) from 2015, when a previous record of 244.8 MT was set over the 2014 trade volume.

Market Players

Recent LNG Market Changes
- The most notable volumetric changes observed over the last five years were the entry of Egypt and growth of China and India on the importing side. On the exporting side, Australia is the gamechanger, with exported volume more than doubling over these five years.

Natural Gas Price Formation

- Even though the global market is moving toward a much more open pricing regime, there are a variety of different methods in use around the world for determining the price of natural gas. This phenomenon is significantly regional.
- Oil Price Escalation (OPE) The price is linked, usually through a base price and an escalation clause, to competing fuels, typically crude oil, gas oil and/or fuel oil. In some cases coal prices can be used as can electricity prices.
- Gas-on-Gas Competition (GOG) The price is determined by the interplay of supply and demand–gas-on-gas competition – and is traded over a variety of periods (daily, monthly, annually, or other periods). Trading takes place at physical hubs (e.g. Henry Hub), or notional hubs (e.g. NBP in the UK). There are likely to be developed futures markets (NYMEX or ICE). Not all gas is bought and sold on a short term price basis, and there will be longer term contracts but these will use gas price indices to determine the monthly price, for example, rather than competing fuel indices. Also included in this category is spot LNG, any pricing which is linked to hub or spot prices and also bilateral agreements in markets where there are multiple buyers and sellers.
- Bilateral Monopoly (BIM)The price is determined by bilateral discussions and agreements between a large seller and a large buyer, with the price being fixed for a period of time – typically one year. There may be a written contract in place, but often the arrangement is at the Government or state – owned company level. Typically there would be a single dominant buyer or seller on at least one side of the transaction, to distinguish this category from GOG, where there would be multiple buyers and sellers trading bilaterally.
- Netback from Final Product (NET) The price received by the gas supplier is a function of the price received by the buyer for the final product the buyer produces. This may occur where the gas is used as a feedstock in chemical plants, such as ammonia or methanol, and is the major variable cost in producing the product.
- Regulation: Social and Political (RSP) The price is determined, or approved, formally by a regulatory authority, or possibly a Ministry, but the level is set to cover the “cost of service”, including the recovery of investment and a reasonable rate of return.
- Regulation: Below Cost (RBC) The price is knowingly set below the average cost of producing and transporting the gas often as a form of state subsidy to the population.
- Regulation: Cost of Service (RCS) The price is knowingly set below the average cost of producing and transporting the gas often as a form of state subsidy to the population.
- No Price (NP) The gas produced is either provided free to the population and industry, possibly as a feedstock for chemical and fertilizer plants, or in refinery processes and enhanced oil recovery. The gas produced may be associated with oil and/or liquids and treated as a by-product.
Liberalizing Market Dynamics

- Liquidity of global markets continues to grow.
- There is a clear trend in moving towards more competitive pricing, as illustrated by the European imports market chart.
- Gas on gas competition drove the pricing of over half of all pipeline imports and a quarter of LNG, and 49% of all imports combined.
- Increasing interconnectedness of the international gas markets is causing regional price gaps to narrow, with a particular benefit to the traditionally more – expensive Asian markets.


Regional Price Differences
There are number off actors that play into the differences in pricing at different hubs around the world, including:
Supply Side Factors
- Variations in the amount of natural gas production
- The volumes of natural gas imports and exports
- The amount of gas in storage facilities (referred to as storage levels)

Natural Gas Contracts
Contract Types

- Short-Term Trade Contract: Volumes traded on a spot basis or under contracts of less than 2 years
- Medium-Term Trade Contract: Volumes traded under a 2 to < 5 year contract
- Long-Term Trade Contract: Volumes traded under a 5+ year contract
Recent Trends
There is a gradual shift from long-term, fixed destination contracts to short-term and medium-term ones, due to an increase in the number of contracts that have the flexible destination option and also due to the emergence of new producers and consumers.
- There is a notable reduction in the average length of contracts
- Contracts with the flexible destination option and with shorter terms are on the rise
- There is an increase in the number of longer-term contracts with the flexible destination option

Sign up for the latest news and publications on natural gas.
Thank You!
Your subscription has been confirmed. You've been added to our list and will hear from us soon.
Get the latest news and updates from IGU
By completing this form, I accept that IGU can store my business information. We may send you informational emails, but you can unsubscribe at any time.

Natural Gas
Download Infographics
Sustainability
Download Infographics
Supply
Download Infographics
Movements
Download Infographics
Markets
Download Infographics
IGU
Follow @IGU_News to get the latest updates.
IGU's 2024 World LNG Report is out now!
This is my favourite annual LNG report. I can't wait to read more but take a look at the trade flows ⬇️
Team USA took 1st this year (no surprise) 🏆
#LNG #USALNG #naturalgas

The global market for #LNG faces supply uncertainty from factors including sanctions on Russian fuel, aging plants and attacks on vessels in the Red Sea, @IGU_News says in its annual report via @markets
The 29th World Gas Conference (WGC2025) Marks One Year Countdown with Exclusive Event in Beijing China
🗓 19 - 21 May 2024
🌐 Beijing, China
🔗 https://www.wgc2025.com/en/web/index/
@WGC_2025 @WGC2025 @igu_news
It’s a Podcast! 🎙 @OxfordEnergy unpacks the 2024 Wholesale Gas Price Report & All You Need to Know About Global #GasPrices. ⬇
🎧 To Listen, go to: https://lnkd.in/ecXEpPda
or Find it on Spotify: https://lnkd.in/ed7VD8S8
& also on Apple Podcasts: https://lnkd.in/eU5gde84
⬇ To

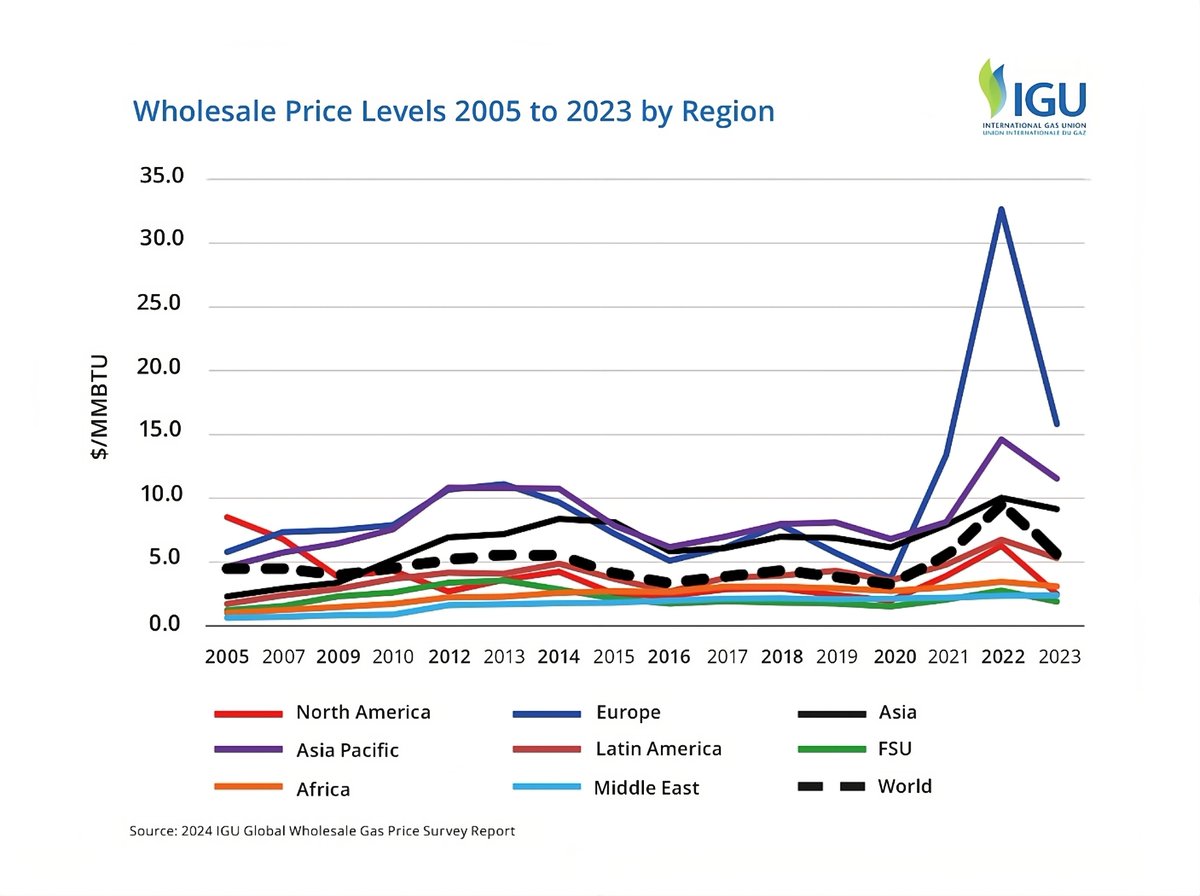
💡 ⬇️ IGU has just released the 2024 Wholesale Gas Survey Report 👉https://igu.org/resources/wholesale-gas-price-survey-2024-edition/ 🔥
📌 After record #gas #prices in 2022, 2023 saw prices fall back. The average World price, while down to $5.70 per MMBTU, was still the second highest average price recorded by the
🌍How has policy and financial innovation managed to build infrastructure quickly in places like Europe, but not in others like Africa?
🚀Join #IGRC2024 's GLOBAL SPOTLIGHT SESSION on INNOVATION & SECURITY with speakers Emeka Ene and Prof. Brenda Shaffer, as they explore

The #IGRC2024 Special Issue of the IGU Global Voice of Gas magazine is here ! 🙌 https://igu.org/news/global-voice-of-gas-1-vol-4/. Read about: #innovation for the #decarbonisation of gaseous energy, #biomethane, #hydrogen, #LNG, #digitisation, #regions, #security and more in global gas with features

Yulan Li, President @IGU_News emphasises the critical role natural gas will continue to play in decarbonising the global energy mix as a viable transition away from coal. #IEWeek